Starfish Diagram for 536626
About Starfish Diagrams
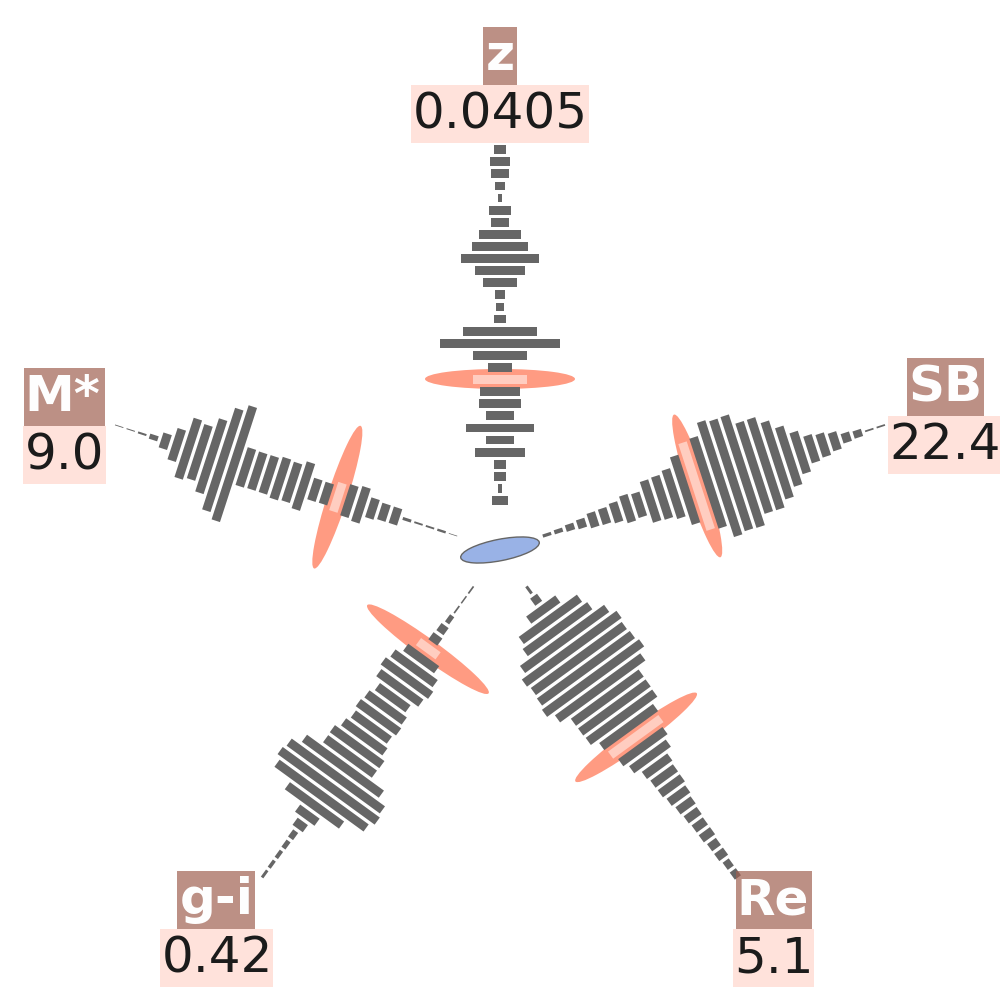
Individual galaxies are visualised in the context of the full sample with starfish diagrams. Each starfish shows seven properties of an individual galaxy. The first five are marked against a histogram of the underlying distribution across the SAMI sample in its entirety. That is, each arm of the starfish is a histogram of a certain variable, with bars justified about the axis, with values increasing (or becoming brighter) outwards. SAMI starfish cover the following set of galaxy properties and approximate ranges:
- redshift: $0.005<z<0.12$,
- stellar mass: $7.4<\log(M_*/M_\odot)<11.9$,
- colour excess: $0.08<(g-i)<1.77$ mag,
- effective radius: $0.2<R_e<9.8$ arcsec, and
- surface brightness at $R_e$: $19.1<SB<24.9$ mag.
In the case where a value lies outside the segment of the distribution shown (approximately 95% of all data) arms are rendered in light gray and arrows indicate the direction toward which the value is to be found. The final two pieces of information are conveyed by the central shape, which represents the ellipticity and position angle of the galaxy.
More information about the starfish method and source code can be found on this repository and ASCL entry, with an article forthcoming on Astronomy & Computing (Konstantopoulos, 2014, in review; arXiv/1407.5619).
Sample Comparison with GAMA
The following starfish diagrams contrast the collective properties of EDR galaxies to those of the SAMI-GAMA parent sample, the subset of the GAMA galaxy survey from which the majority of the SAMI sample will be drawn. No individual galaxy has been highlighted here. Bins are matched between the two plots and dots in the EDR starfish indicate empty bins.
SAMI EDR

SAMI-GAMA